

How to Analyse Your Facebook Ad Results
Measuring your Facebook Ad Results can be tricky because there are so many ways to do it. Metrics can influence business decisions. Choosing the right metrics is absolutely vital for success.
Wondering which key metrics you should be tracking?
Let me share with you 7 important Facebook ad results (metrics) that I cannot live without, and where to find them in Ads Manager.
1. Return on Ad Spend (ROAS)
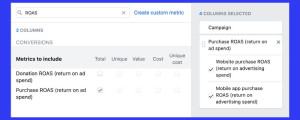
Return on ad spend (ROAS) is the amount of revenue generated for every dollar spent on advertising. It’s the most important metric to track for your Facebook ads, as it tells you whether your ads are profitable.
To calculate ROAS, divide your total revenue by your total ad spend. For example, if you generated $270 in revenue from your Facebook ads and spent $54 on ad spend, your ROAS would be 5 times.
You can find your ROAS in Ads Manager under the “Purchase ROAS” column.
Need help with your social media? Book your 1:1 consultation today and get started.
2. Purchase Conversion Value
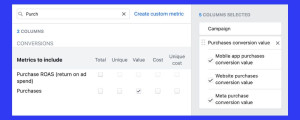
Purchase conversion value is the total value of purchases made from your advertising efforts. This metric tells you how much money your Facebook ads are generating.
You can find your purchase conversion value in Ads Manager under the “Purchase Conversion Value” column.
3. Cost per Purchase
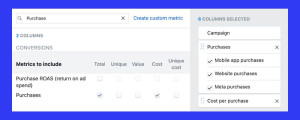
Cost per purchase is the amount you spend to acquire a single new customer. This metric tells you how efficient your Facebook ads are at converting clicks into sales.
To calculate the cost per purchase, divide your total ad spend by the number of purchases made. For example, if you spent $54 on ad spend and generated 10 purchases, your cost per purchase would be $5.40.
You can find your cost per purchase in Ads Manager under the “Cost per Purchase” column.
4. Leads
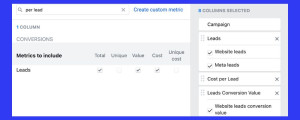
A lead is a person who shows interest in your brand’s products or services. This could be someone who subscribes to your email list, fills out a contact form, or clicks on a link to your website.
5. Earnings per Lead (EPL)
Earnings per lead (EPL) is the amount of revenue generated divided by the total number of leads it took to generate that revenue. This metric tells you how much each new lead is worth to your business.
To calculate EPL, divide your total revenue by the number of leads generated. For example, if you generated $270 in revenue from 100 leads, your EPL would be $2.70.

Explore how the Travel Wallet, an extraordinary collection of crucial tools and insights, can prepare you for success in digital marketing and the digital nomadic lifestyle.
6. Cost per Lead (CPL)
Cost per lead (CPL) is the amount you spend to acquire a single new lead. This metric tells you how effective your Facebook ads are at generating leads.
To calculate CPL, divide your total ad spend by the number of leads generated. For example, if you spent $130 on ad spend and generated 100 leads, your CPL would be $1.30.
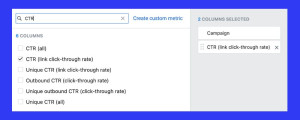
7. Click-Through Rate (CTR)
Click-through rate (CTR) is the percentage of people who see your ad and click on it. This metric tells you how engaging your ad copy and creative are.
To calculate CTR, divide the number of clicks by the number of impressions. For example, if your ad received 100 clicks and 1,000 impressions, your CTR would be 10%.
You can find your CTR in Ads Manager under the “CTR” column.
What to do if you’re not getting the results you want
If you’re not getting the results you want from your Facebook ads, there are a few things you can do:
- Review your targeting. Make sure you’re targeting the right people with your ads.
- Optimise your ad copy and creative. Make sure your ad copy is clear, concise, and persuasive, and that your creative is visually appealing.
- Test different ad placements. Try different ad placements, such as the news feed, the right column, or Instagram, to see where your ads perform best.
- Adjust your budget. If you’re not getting enough results with your current budget, increase it.
By tracking these 7 metrics, you can get a better understanding of how your Facebook ads are performing and make necessary adjustments to improve your results.
I hope this helps!
Follow or connect with Crom Salvatera on LinkedIn.
